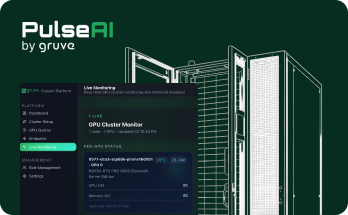
Just Launched Gruve PulseAI Platform, your private AI infrastructure, production-ready in under 2 weeks.PulseAI is live — private AI, ready in 2 weeks.

See PulseAI
Why Now

Fragmented telemetry
hides the signal when it
matters most 

79%

less downtime experienced by organizations with full-stack observability compared to those without it (State of Observability Report, 2026)

~50%

of organizations juggle five or more tools for observability, fragmenting telemetry across infrastructure and applications (State of Observability Report, 2026)

62%

report hourly outage costs of at least $1M during high-impact incidents (State of Observability Report, 2026)

Outcome in numbers

Splunk Observability outcomes
you can measure

Typical roi

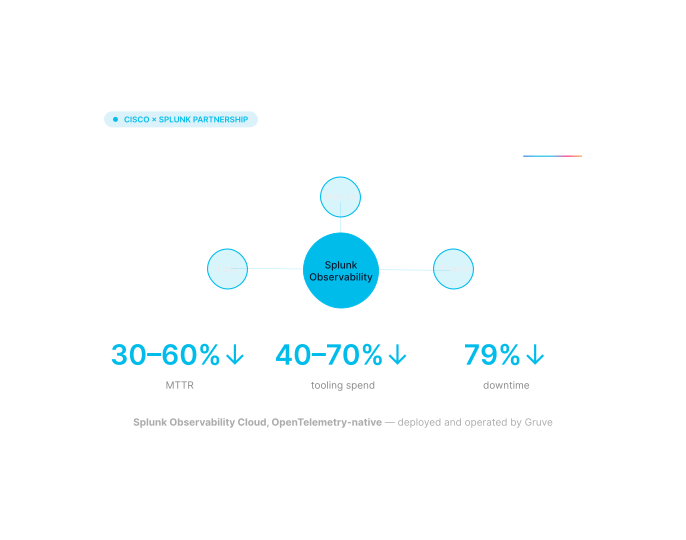
30–60%

reduction in mean time to resolution (MTTR)

40-70%

reduction in total observability tooling spend through consolidation

79%

less downtime with full-stack observability in place

Time to value

1-2 weeks

Onboarding and instrumentation planning complete

4-8 weeks

Deployment begins delivering unified visibility

Ongoing

Managed Service active after onboarding

Core services

Three ways we deliver Splunk Observability

From first assessment to ongoing operations, pick the entry point that matches
where you are today.

A focused audit of your current infrastructure and application monitoring environment reviewing tool coverage, alert hygiene, and licensing overlap, with prioritized recommendations before you commit to a change.

For organizations:

  • Running fragmented or legacy monitoring tools across infrastructure and applications
  • Planning a consolidation onto Splunk Observability
  • Needing a second opinion on current alerting and dashboard health
Engagement Model One-time engagement, 1–3 weeks

Problems It Solves

  • Unclear monitoring coverage across infrastructure and applications
  • Alert fatigue from noisy, redundant, or poorly tuned tools
  • Tool sprawl with overlapping licensing and unclear cost drivers
  • No documented baseline before a consolidation or migration

How It Works

  1. 1 DiscoverInventory current monitoring tools, coverage, and data sources
  2. 2 AnalyzeAlert hygiene, redundancy, and tool overlap analysis
  3. 3 EvaluateCoverage gaps and best-practice comparison against Splunk Observability
  4. 4 ReportRisk-ranked findings and prioritized recommendations

Deliverables

  • Monitoring tool and coverage inventory
  • Alert hygiene and noise review
  • Tool overlap and licensing cost analysis
  • Best-practice gap analysis
  • Prioritized consolidation roadmap

Outcomes

  • Clear visibility into current observability posture
  • Actionable consolidation roadmap
  • Early visibility into potential tooling cost savings
  • Audit-ready documentation

End-to-end deployment of Splunk Observability Cloud across your infrastructure and application estate, covering infrastructure monitoring, APM instrumentation, log observability, and dashboards, configured and tuned for production.

For organizations:

  • Implementing Splunk Observability for the first time
  • Replacing fragmented, disconnected monitoring tools with a unified platform
  • Needing visibility across modern, cloud-native, and microservices environments
Engagement model Project-based, 4–8 weeks typical

Problems it solves

  • Fragmented monitoring tools with no correlation across metrics, traces, and logs
  • Manual, inconsistent instrumentation across services
  • Blind spots in containerized, Kubernetes, and cloud-native environments
  • No unified dashboards or alerting across infrastructure and applications

How it works

  1. 1 DesignRequirements gathering, architecture, and instrumentation planning
  2. 2 BuildDeploy OpenTelemetry collectors and infrastructure monitoring agents
  3. 3 IntegrateInstrument applications for APM, traces, and log correlation
  4. 4 ConfigureBuild dashboards, detectors, and alerting rules
  5. 5 Validate & HandoffTesting, tuning, and knowledge transfer

Deliverables

  • Configured and validated Splunk Observability Cloud tenant
  • Infrastructure monitoring across hosts, containers, and Kubernetes
  • APM instrumentation across applications and services
  • Dashboards and alerting/detector rules
  • Documentation and knowledge transfer

Outcomes

  • Unified observability across infrastructure and applications
  • Faster mean time to detect (MTTD) issues
  • Reduced monitoring tool sprawl and licensing overlap
  • Foundation for ongoing managed operations

Ongoing, expert-led operation of your Splunk Observability environment — monitoring infrastructure and applications, tuning alerts and dashboards, and reporting so your team doesn't have to.

For organizations

  • Lacking in-house observability expertise
  • Needing 24x7 monitoring across infrastructure and applications
  • Wanting proactive performance issue detection before it affects users
Engagement model Ongoing subscription, annual terms

Problems it solves

  • Alert fatigue from too many uncorrelated notifications
  • Detector and dashboard configurations drifting out of date as the environment changes
  • Performance degradation going undetected until it becomes an incident
  • No visibility into capacity and performance trends over time

How it works

  1. 1 Monitor24x7 infrastructure and application monitoring
  2. 2 TriageAlert investigation, correlation, and response
  3. 3 OptimizeOngoing dashboard and detector tuning
  4. 4 ReportMonthly performance and capacity reports
  5. 5 SupportOngoing platform administration

Deliverables

  • 24x7 infrastructure and application monitoring
  • Alert triage and tuning
  • Monthly performance and capacity reports
  • Dashboard and detector maintenance
  • Ongoing platform administration and support

Outcomes

  • Proactive issue detection before user impact
  • Reduced alert noise and fewer false positives
  • Freed internal resources
  • Consistent visibility across infrastructure and applications

Trusted by Security Leaders

"Enterprises need secure AI infrastructure that is simple to deploy,
trusted, and easy to manage from day one. Our work with Gruve brings
assurance directly into the PulseAI Platform, so enterprises can move
fast without compromising on governance or control."

https://gruve.ai/wp-content/uploads/2026/05/Frame-236-1.png

Cassie Roach

Global VP of Cloud and AI Infrastructure Partner Sales at Cisco
WHY GRUVE

Why Gruve for Splunk Observability

Deep observability expertise, backed by Gruve's global delivery model and direct Cisco/Splunk partnership.

Proven expertise

Successful Splunk Observability deployment and managed operations engagements delivered across enterprise environments.

Full-stack specialization

Dedicated engineers focused on infrastructure monitoring, APM, and OpenTelemetry-based instrumentation.

Flexible service models

Professional services for deployment projects, managed services for ongoing operations.

Multi-environment
support

Experience across on-premises, cloud, containerized, and Kubernetes environments.

Partnership with Cisco and Splunk

Direct collaboration ensures access to the latest Splunk Observability capabilities and best practices.

30-60%

Operational efficiency

Challenge: fragmented tooling with no correlation across metrics, traces, and logs.

Result: reduction in mean time to resolution.

40-70%

Cost efficiency

Challenge: multiple overlapping monitoring tools and licenses.

Result: reduction in total observability tooling spend.

FAQs

Frequently asked questions about
Splunk Observability services

Is this the same as the Managed Infrastructure and Application Observability service?

No — Splunk Observability Tool Deployment is a one-time, project-based engagement that builds and configures your Observability Cloud environment. Managed Infrastructure and Application Observability is the ongoing subscription that operates it day to day after go-live. Many organizations start with a deployment, then move into Managed Services.

Do you support both infrastructure and application monitoring, or just one?

Both. Deployment covers infrastructure monitoring (hosts, containers, Kubernetes) and application performance monitoring (APM, traces) together, and Managed Services operates both in an integrated way rather than as separate workstreams.

Can you deploy Splunk Observability alongside our existing monitoring tools?

Yes. Deployment can run in parallel with existing tools during a phased transition, with dashboards and alerting migrated to Splunk Observability as instrumentation coverage expands.

Does Managed Services include tuning alerts, or just monitoring?

Managed Services includes ongoing alert and dashboard tuning as a core part of the offering, not an add-on — this is what keeps alert noise down and detection accurate as your environment changes.

Can Managed Services take over an environment we deployed ourselves or with another provider?

Yes. Managed Infrastructure and Application Observability can onboard an existing Splunk Observability environment regardless of who deployed it, typically starting with a review of current instrumentation and dashboards before ongoing management begins.

Get Started

Get full-stack visibility with
Splunk Observability

Expert Splunk Observability deployment and managed operations, from first instrumentation
to full production visibility, and everything after.

    Response within 24 hours · NDA available on request