Blog
Getting to an evolved context graph: Baby steps on a strong foundation
February 21, 2026
Context graphs are knowledge graphs done right. Learn Gruve’s 4-step approach to evolving enterprise knowledge graphs into decision-capturing context graphs.

The concept of the “Context Graph” has exploded into the AI discourse over the last two months, largely sparked by Foundation Capital’s thesis on “AI’s trillion-dollar opportunity”. The idea is compelling: moving beyond static data to capture the decision traces—the “why” and “how”—of enterprise operations.
Important thought leaders are already taking sides. Arvind Jain, CEO of Glean, has endorsed the concept, detailing how Glean has spent years building the technical stack to make context graphs a reality. Conversely, HubSpot founder Dharmesh Shah has weighed in with a “reality check,” expressing skepticism over the timeline. He argues that most companies are still struggling with basic data unification and aren’t ready to install a “three-car garage” (context graphs) when they don’t yet own a car (agents).
At Gruve, we see the truth somewhere in the middle. Beyond the catchy name, I believe context graphs are essentially knowledge graphs done right. They are causal, dynamic graphs that update constantly with new context. We are leveraging enterprise knowledge graphs as the bedrock for our Data & AI work. While making them “full context graphs” is a mission with progressive milestones, we are more optimistic about accelerated fruition than Dharmesh—provided you take the right baby steps.
Here is how we at Gruve are building that evolved future, step by step.
Step 1: The Domain Foundation (The “Canonical” Layer)
Foundation Capital argues that while agents may become the new interface, “something still has to be canonical underneath”. We agree. You cannot model the “why” if you haven’t defined the “what.”
At Gruve, we build a solid foundation for every new domain we serve—whether it is SaaS, Auto Manufacturing, Pharmaceuticals, or Banking—before we ever ingest a single byte of customer data. With the help of AI and domain-expert humans in the loop, we create a Domain Knowledge Graph.
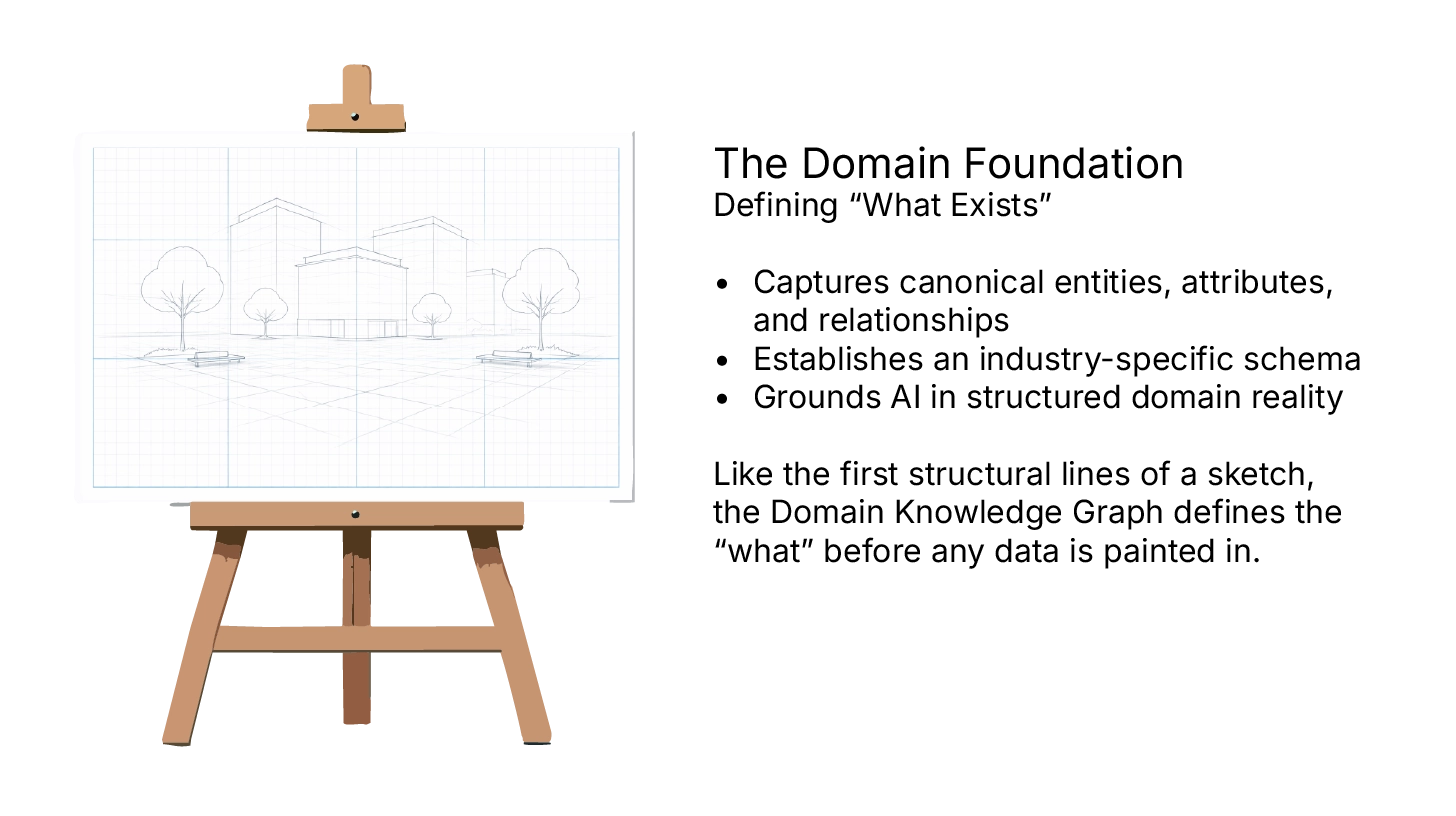
This graph captures all canonical entities, attributes, and relationships specific to that industry. We also pre-define the critical business optimization use cases. For example, in the SaaS domain, we map out the logic for reducing customer churn or targeting customers for upsell/cross-sell. This acts as the “schema” for the business, ensuring that when we do deploy AI, it isn’t hallucinating relationships but grounding them in industry reality.
Step 2: Structured Data Integration (The “State” Layer)
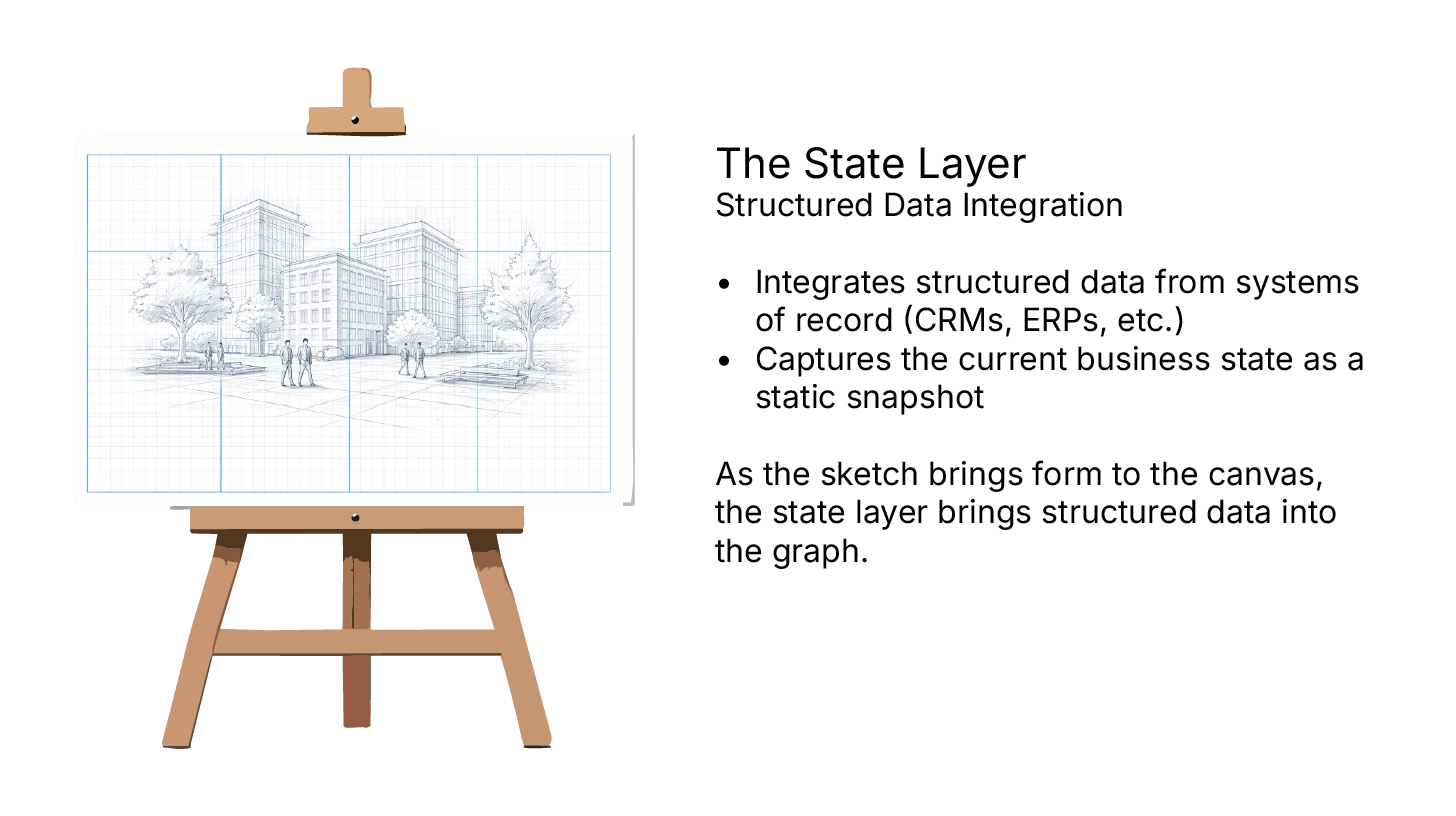
Once we engage with a specific customer—let’s call them SaaSCo—we take the generic Domain Knowledge Graph and evolve it. We connect to the customer’s data cloud to ingest the structured data typical for that domain, building on a trusted data foundation that makes this data accurate, governed, and AI-ready.
This aligns with what the industry calls “Systems of Record” (CRMs, ERPs, etc.). This data provides the current state of the world: knowing that a customer is in the “Renewal” phase or that a ticket is marked “High Priority.” However, as Glean points out, systems of record effectively capture “what” exists, but they rarely capture the “how” or the variability of execution.
Connecting this structured data is a crucial milestone, but it is only the beginning. It gives us a static snapshot of the business.
Step 3: Unstructured Data & The “How” (The Context Layer)
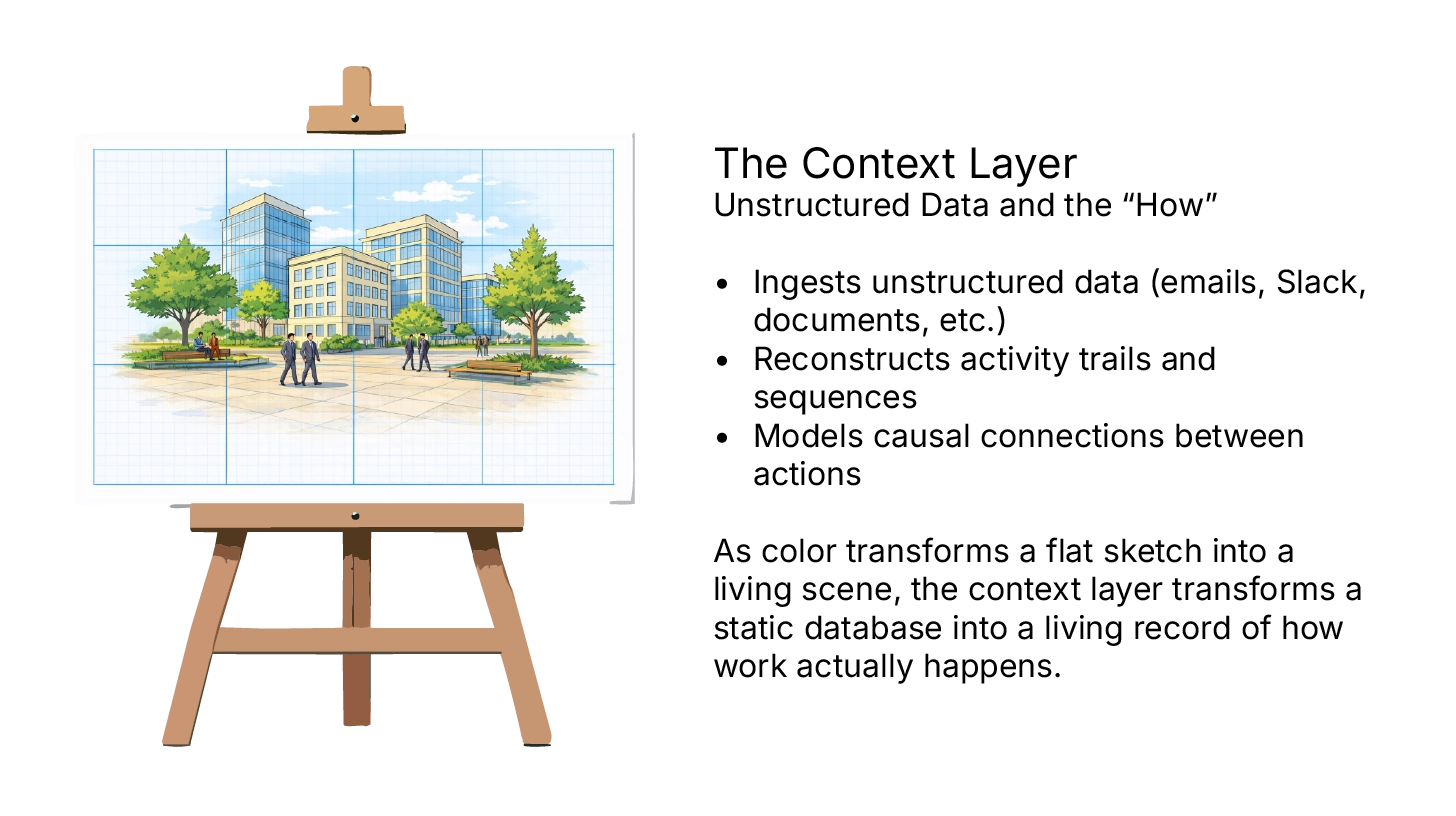
The next stage of evolution is where the graph begins to come alive. We ingest the customer’s unstructured data—documents, slack threads, emails, and tickets.
This is where the “Context Graph” truly differentiates itself from a standard database. As Glean’s engineers note, the real work happens in meetings, chats, and docs, not just in the CRM fields. By integrating this layer, we move from retrieval to reasoning observing not just state, but activity.
This allows us to see not just that a deal closed, but the “digital trail” that led to it: the specific sequence of emails, the contract redlines in a Google Doc, and the internal Slack debate about pricing. Glean describes this as modeling the “how”—the causal edges between events (e.g., “Message A triggered Update B”).
Step 4: The Decision Layer (The “Why”)

The final evolutionary stage—the “Holy Grail” Foundation Capital describes—is capturing decision traces. This is the layer that explains why a discount was approved or why an exception was granted.
Currently, this logic lives in people’s heads or fleeting conversations. By layering AI agents over our evolved graph, we aim to capture these traces in real-time. When an agent (or a human assisted by our tools) makes a decision, that action is recorded back into the graph as a new edge.
Why We Are Optimistic
Dharmesh Shah argues that companies aren’t ready because they haven’t deployed agents at scale yet. He believes you can’t capture decision traces without the agents to generate them.
However, our approach at Gruve solves this “chicken and egg” problem. We don’t wait for the agents. We build the Knowledge Graph (Step 1 & 2) and the Contextual Data Layer (Step 3) first. As Glean notes, “activity signals on their own are noisy; you need knowledge graphs underneath to make that activity meaningful”.
By establishing this strong foundation early, we aren’t just waiting for a future of autonomous agents; we are building the infrastructure that makes them possible. Achieving a rich, useful context graph is indeed a mission with slow progress, but by treating it as an evolution of the Knowledge Graph rather than an entirely new invention, we are seeing benefits today, not just in a theoretical future.